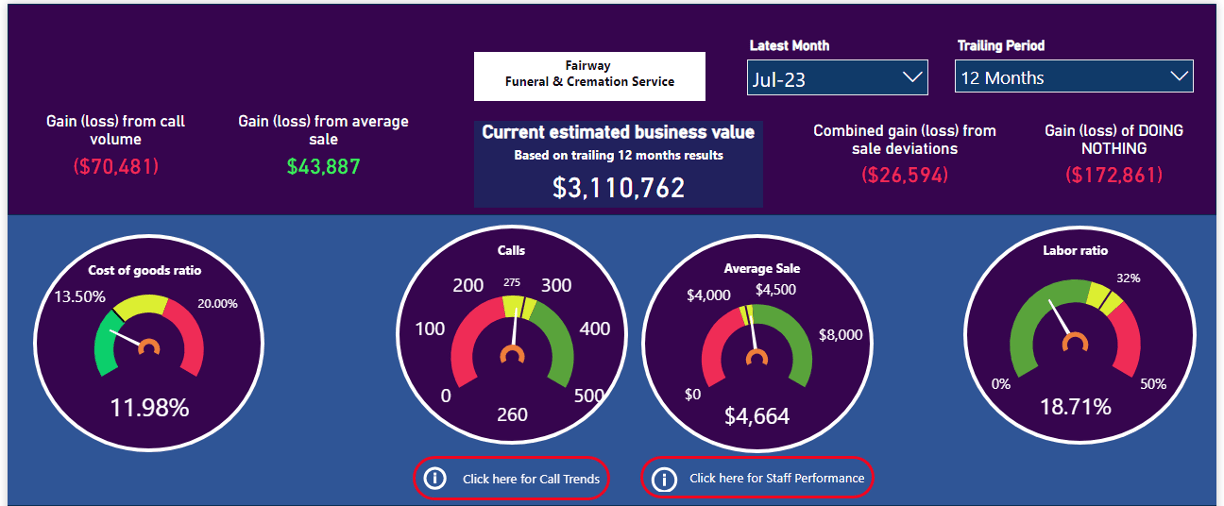
Fractional CFO Dashboard


It begins with an assessment
Because each user is unique, the process of “onboarding” must be customized.
So, it begins with a financial assessment. Once we receive 3 years of financial information and two years of case management information we recast your information into the categories commonly used for comparison purposes in the funeral profession. This allows us to determine your unique metrics with specific regard to:
- Net Sales
- Average Sales
- Volume
- Disposition type (if you keep that data)
- Cost of goods sold
- Labor
- EBITDA(R)
Having compiled, collated and categorized your data we provide you with:
- An estimate of current value
- Current and target values and ratios
- Recommendations for improvement
- suggestions on how you can address these recommendations
- A forecast budget
- Budgeting is a collaborative effort. There is no point in setting targets you can’t or won’t achieve. We do all the “heavy lifting” and then discuss achievability with you so that the forecast is realistic.
Your Data At a Glance
Funeral Directors are rarely analytical. Likewise analytical people are rarely other directed. The purpose of the Fractional CFO Dashboard is to allow users to understand Key factors at a glance and know what to do about deviations.
I tell my clients that the colors are intended to convey urgency:
- Green = “Go Back To Sleep”
- Yellow = “when you have time you might want to look at this closer”
- Red = “Stop what you are doing and call someone”
The dials, trendlines and bar charts are intended as “drill down” features that enable you to see what is changing and how fast it is changing. More important, is a particular deviation isolated to a location(s) or arranger(s).
During the first year or so, I help you gain more and more expertise so that, ultimately, you only need me occasionally.
The charts and dials are broken down any way you want but we recommend you look at it by location, arranger and disposition type.
Each “drill down” can be filtered for users. We recommend that:
- Owners and executives have access to all the data
- Location managers have access to only their location data
- Arrangers have access only to their personal results
Key Metrics
We Recommend that you limit your focus to the following:
- 2 key levers
- volume
- Net average sale
- 2 Primary expenses
- Cost of Goods
- Labor
- 1 Key Result
- EBITDA(R)
Fractional CFO
The title:”Fractional CFO” refers to my role in developing your knowledge and utilization of this tool. This tool is intended to empower the non-analytical and / or non – financial person to quickly grasp key concepts and be able to manage by exception. The visualization of tabular data empowers you to see what needs your attention quickly. But, then, it is necessary to understand the cause and effect behind the results so you can quickly narrow your time and attention to that which will achieve the greatest and quickest impact.
To accomplish this I will review each client’s performance at least quarterly (and, in some cases, monthly) and demonstrate how to look at results appropriately and effectively. It is my hope this “hand – holding” will not be necessary for more than two years and in many cases I hope it will be only one year. At the same time, I anticipate some users will want a fractional CFO, familiar with their business, to talk with periodically. I am prepared to provide that service or teach your local accountant to provide it.
Want to Know More?
Complete and submit the form below